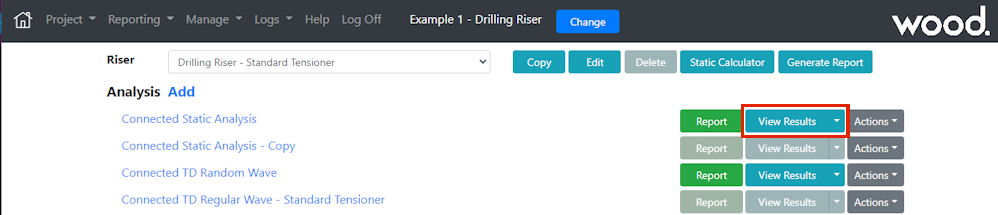
To view results, select an analysis that has been run and click on the View Results button
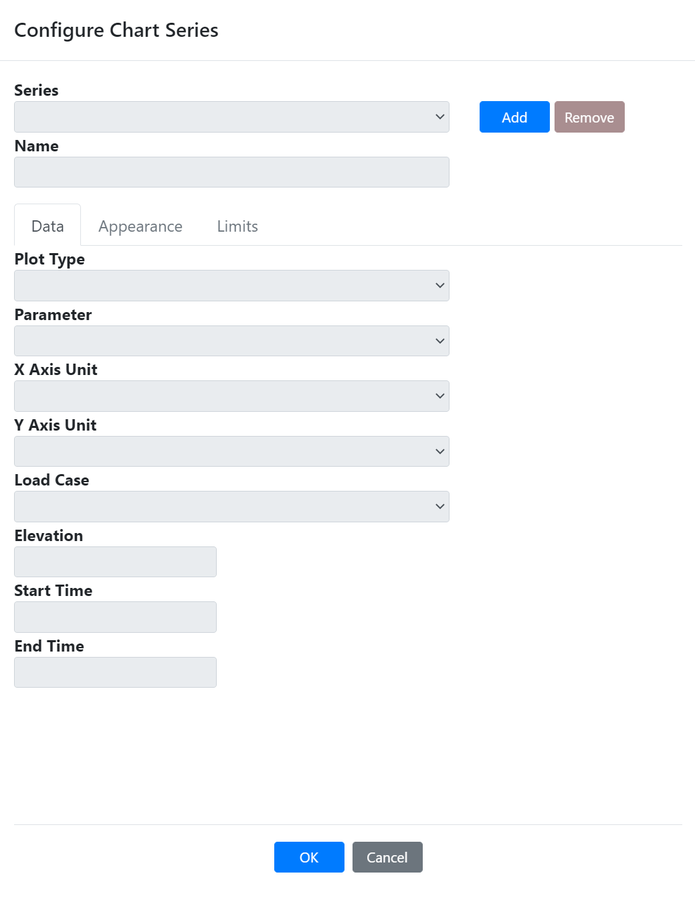
The Chart tab on the Results page appears by default. Clicking on configure will display a pop up form

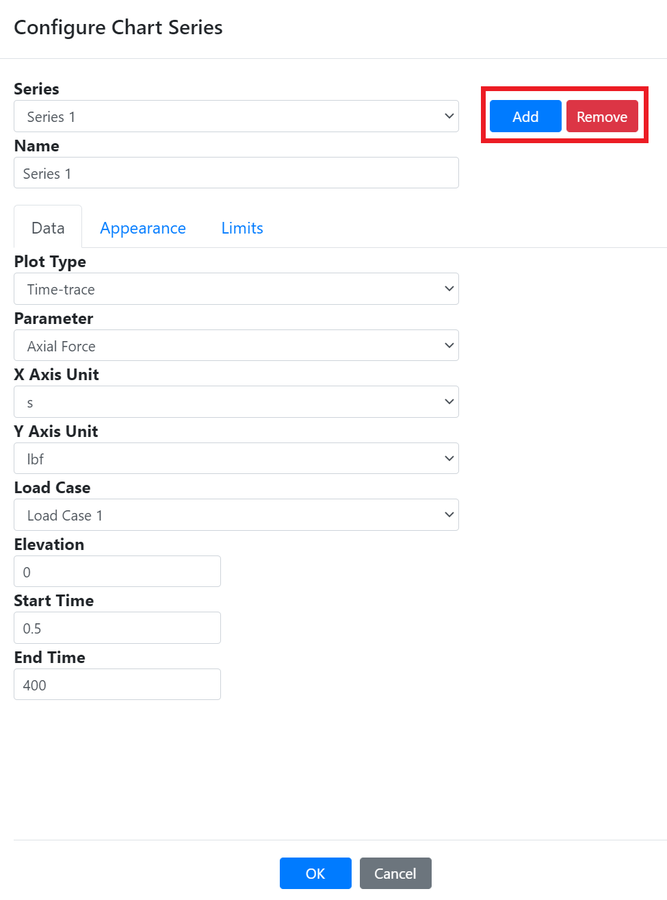
Default parameters are displayed, clicking the add button adds a new series and enables the data, appearance and limits parameters for editing
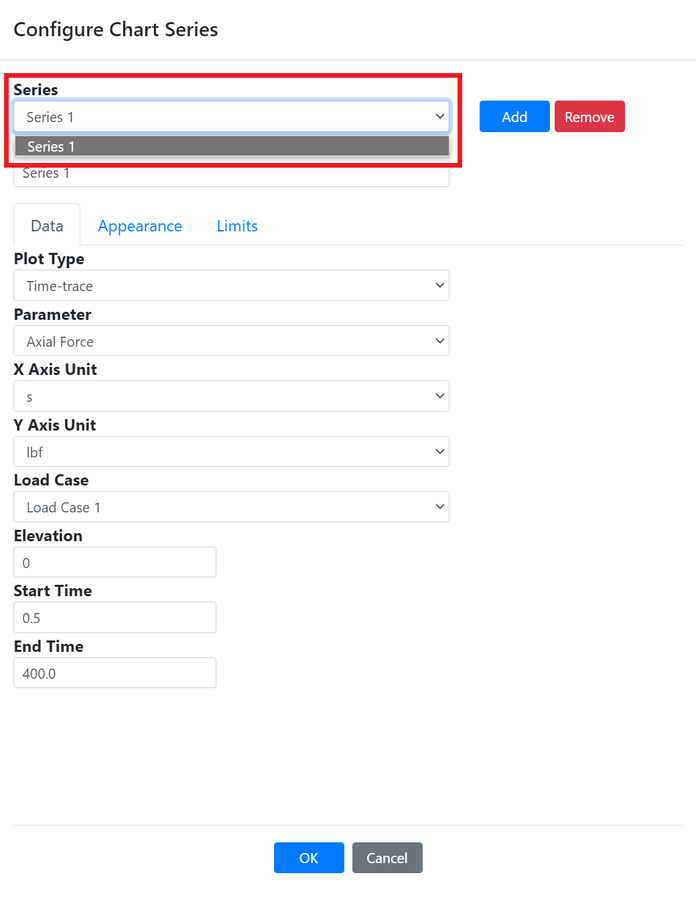
A dropdown list of series is available and selecting a different series allows you to edit it
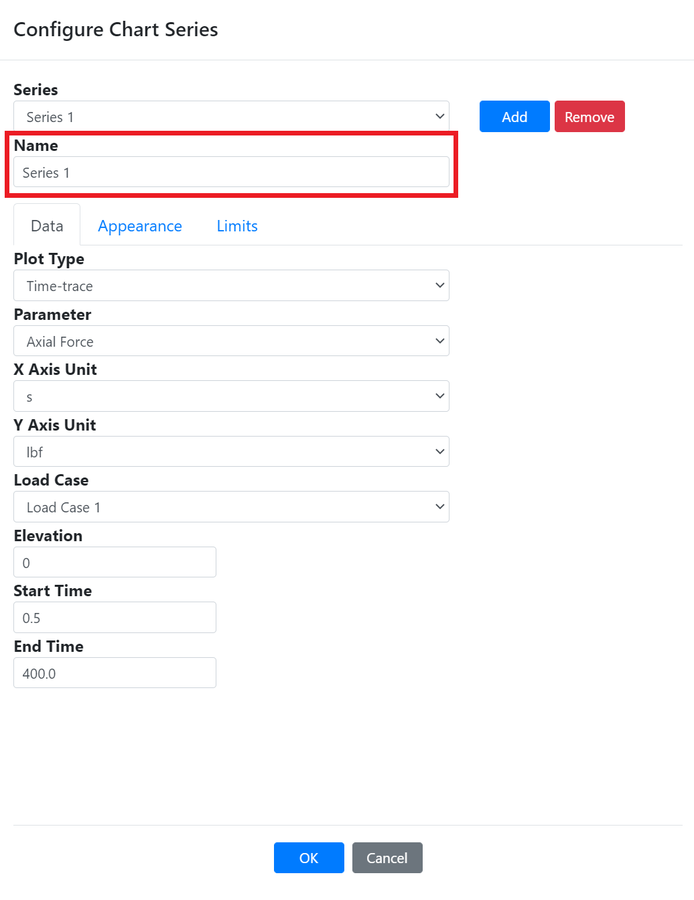
The series name can be changed or left to its default name. The name must be unique
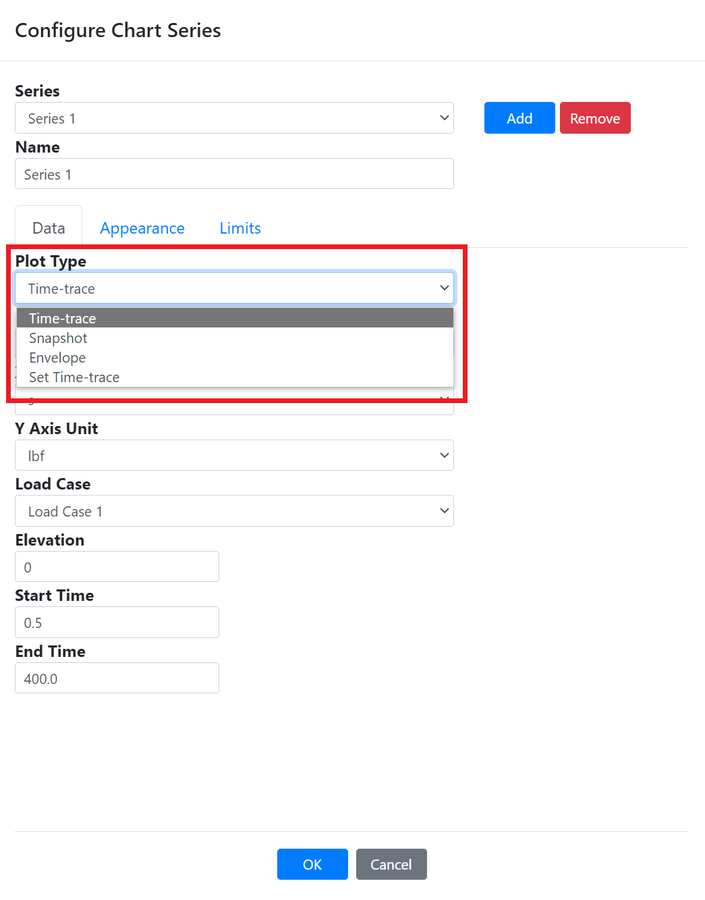
The plot type to view can be selected, depending on the analysis that has been selected
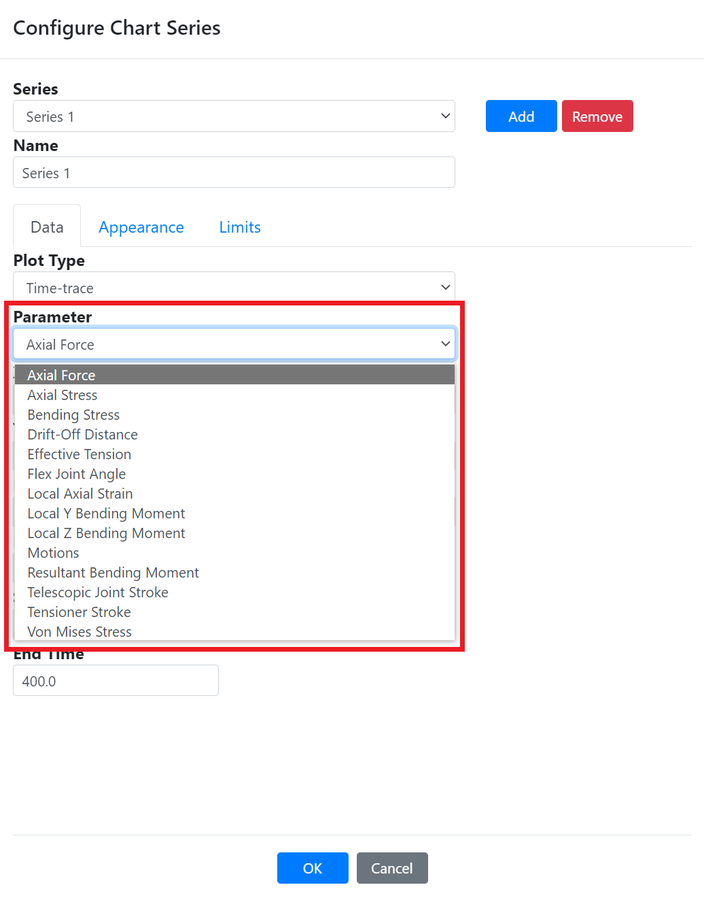
The type of parameter that the user wants to plot can be selected
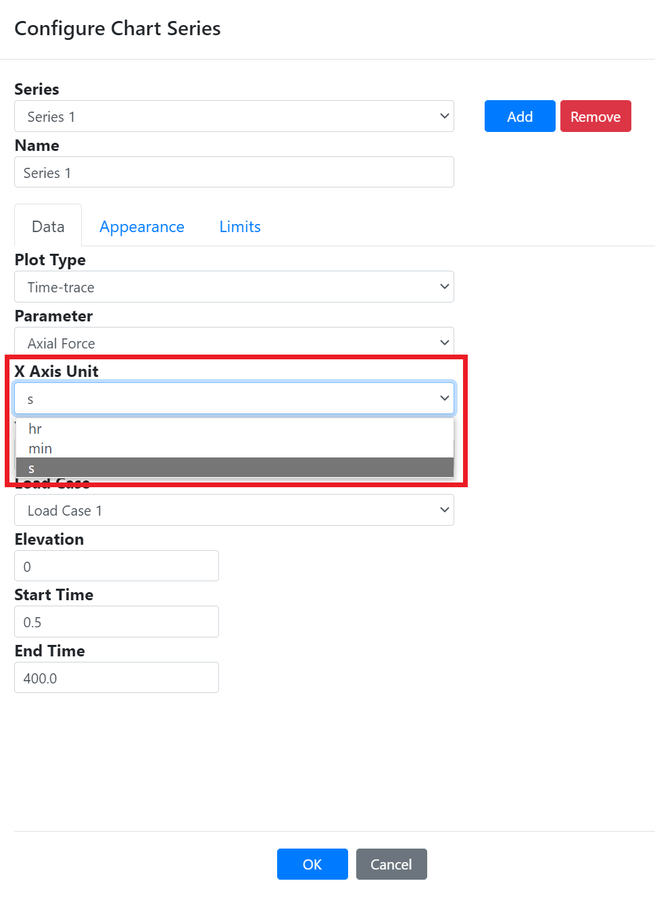
X-Axis units can be selected
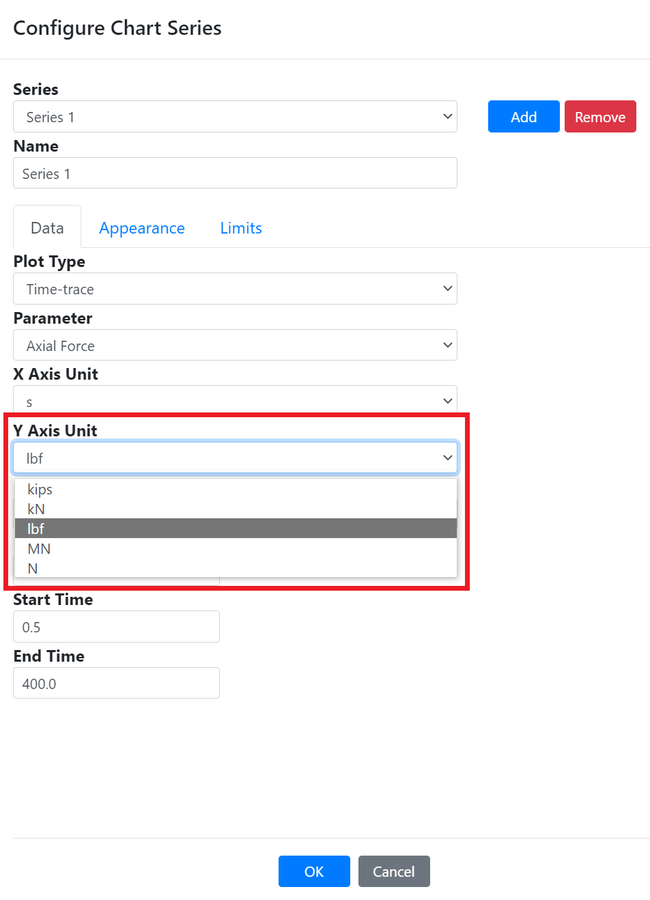
Y-Axis units can be selected
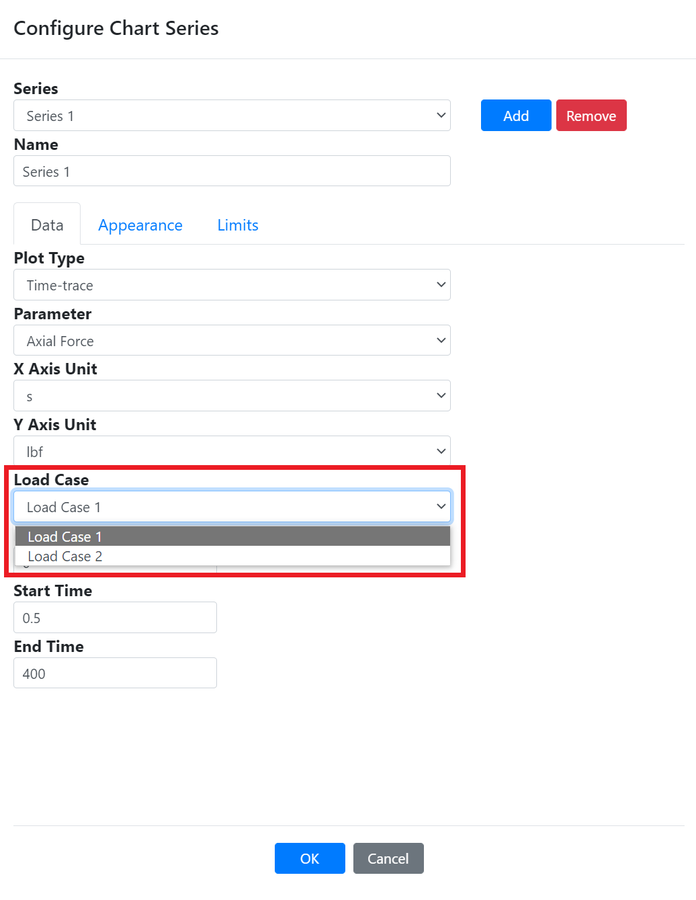
You can plot the data for any of the load cases by changing the selection
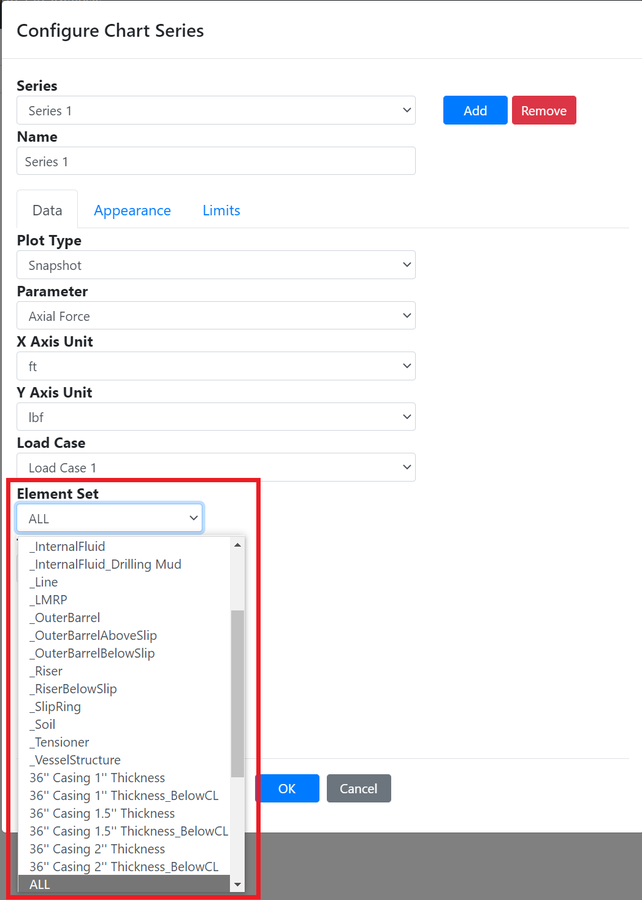
Element Set can be configured, default being All. This is only available for certain plot types
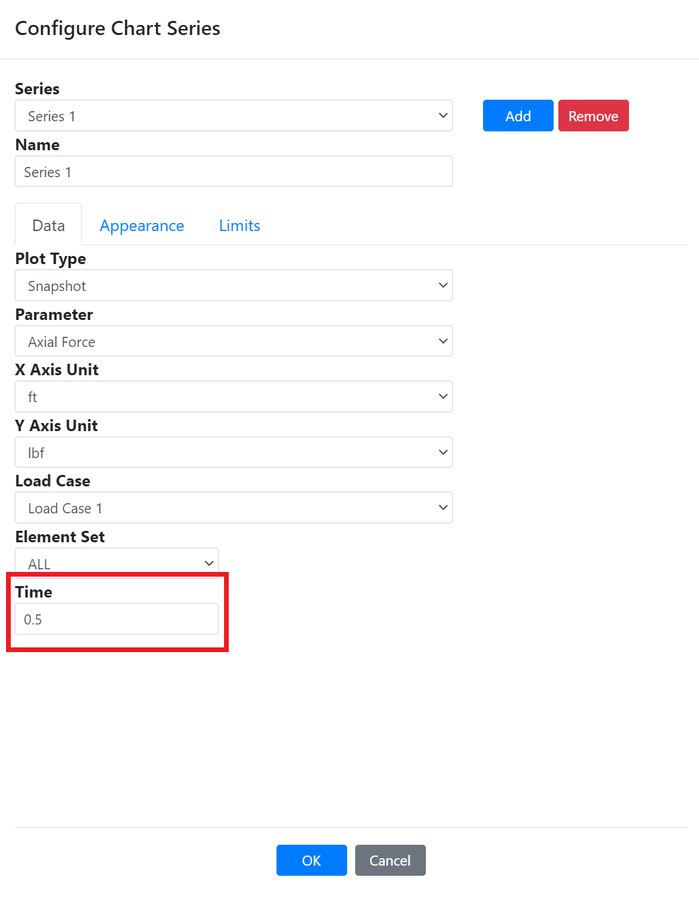
Time can also be configured for non static analysis. For some plot types, such as time-traces, this is will be a range
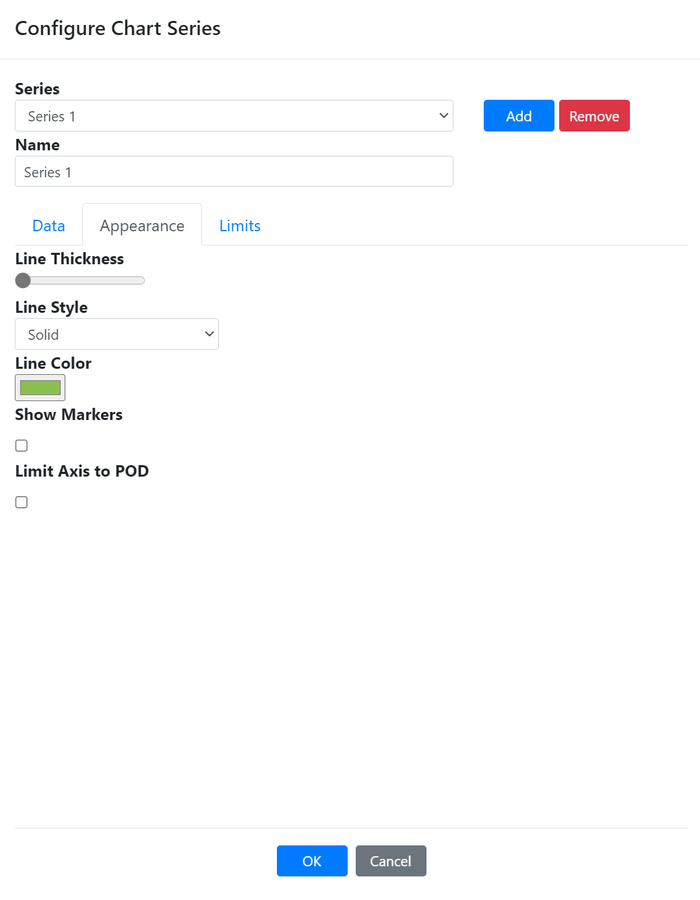
The appearance tab contains a number of options to affect the appearance of the selected series.
The limits tab contains a number of options to define custom limit lines from the selected series.
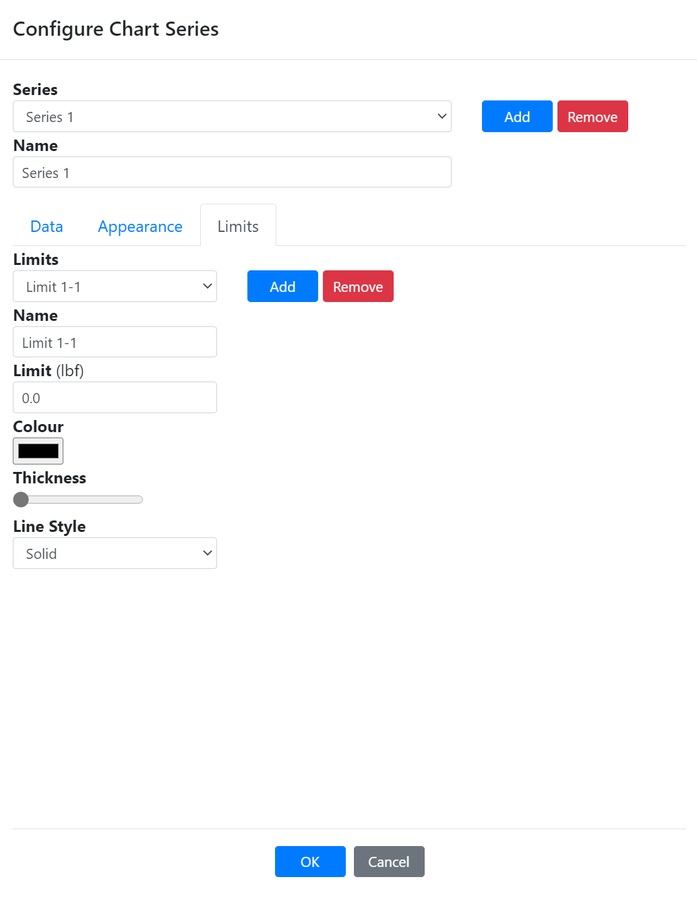
NOTE: Each series permit up to 3 custom limit lines.
Once the chart is configured, click OK to create the chart.
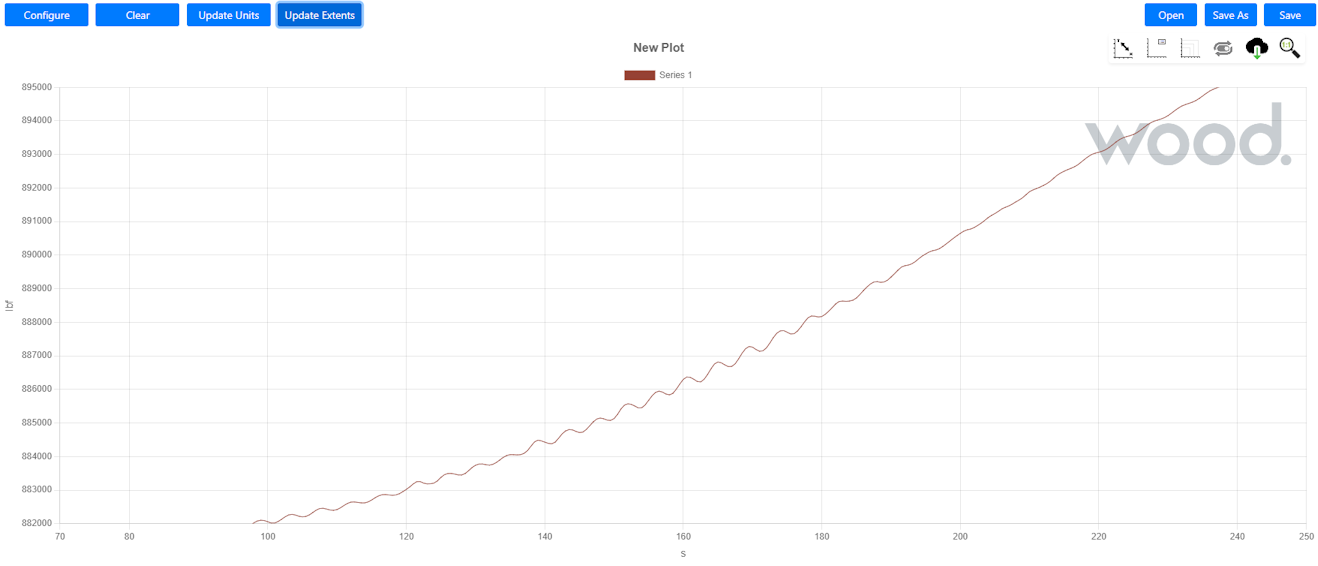
The chart is then generated and may look like the image shown below
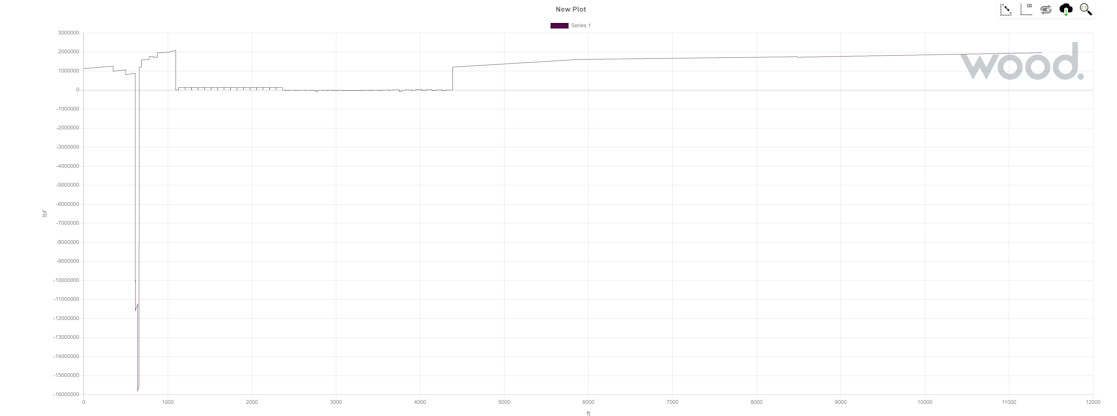
The addition of multiple series is possible by clicking the Add button which copies the currently selected series. The Remove button will remove the currently selected series
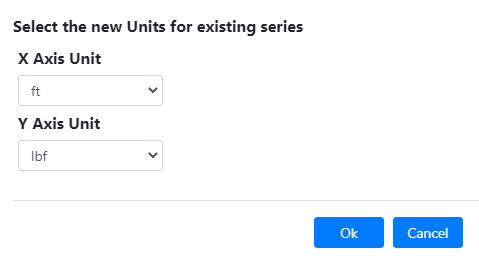
The units for the x and y axes can be updated by clicking the Update Units button and choosing units from the resulting form
Update Extents enables the user to adjust the visible range of the x and y axes on the chart.
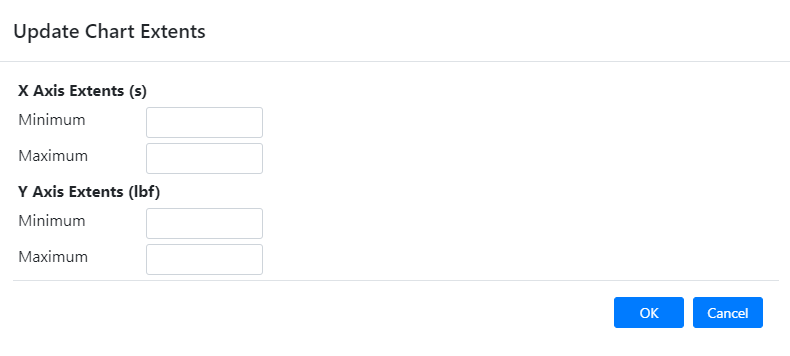
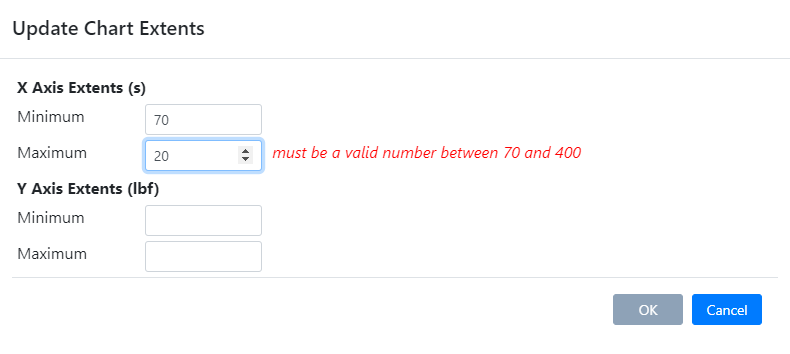
When entering extents, all values are optional. The user can specify any one input or all inputs. If both Minimum and Maximum are specified for the extents, the maximum must be greater than the minimum. The form will display an error showing the valid extents for the given input.
On entering the extents and clicking OK, the extents are immediately applied to the chart. All data is present and the chart can be zoomed in and out or panned using the mouse.
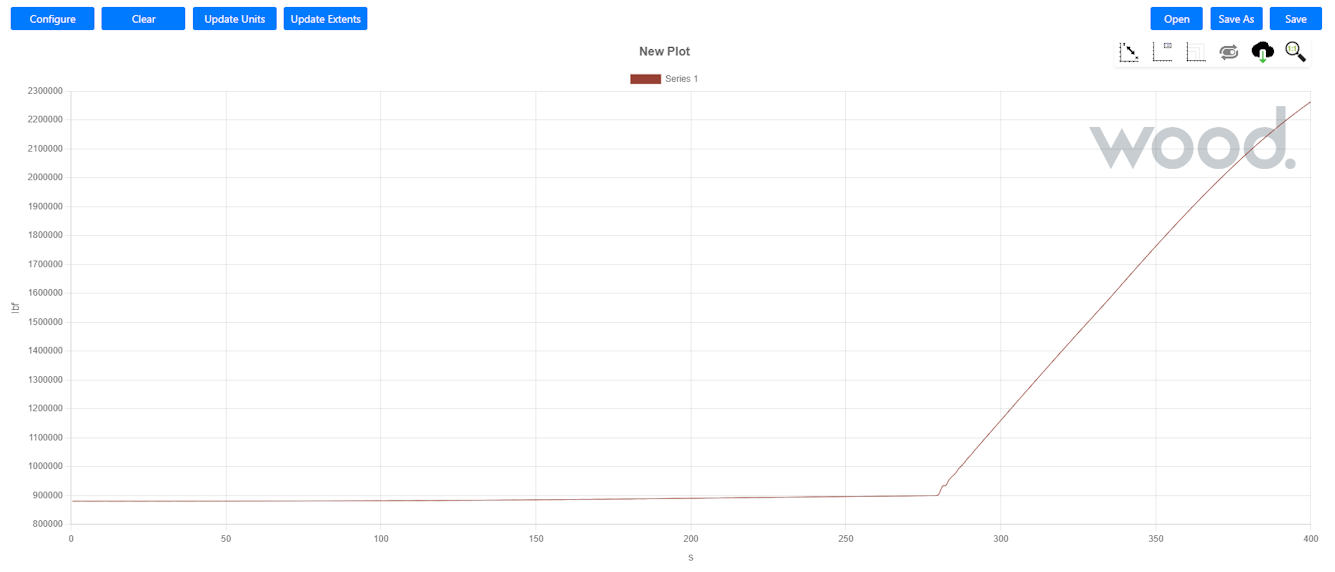
Charts can be saved and previously saved charts can be opened. Various settings for the charts can be changed using the icons
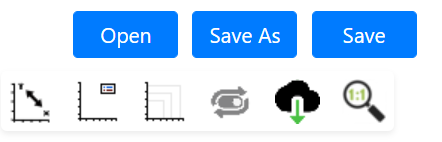
The Switch Axis icon will switch the x and y axes in the chart

The below chart shows the Switch Axis button toggled off
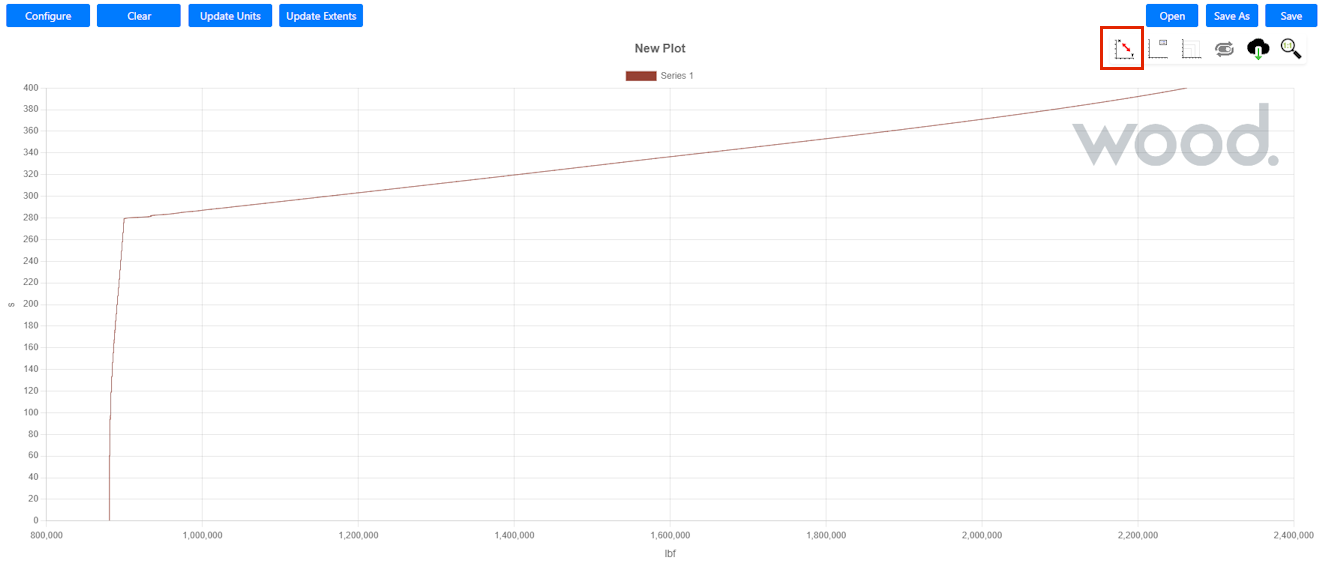
This chart shows the Switch Axis button toggled on. The x and y axes are switched in this case
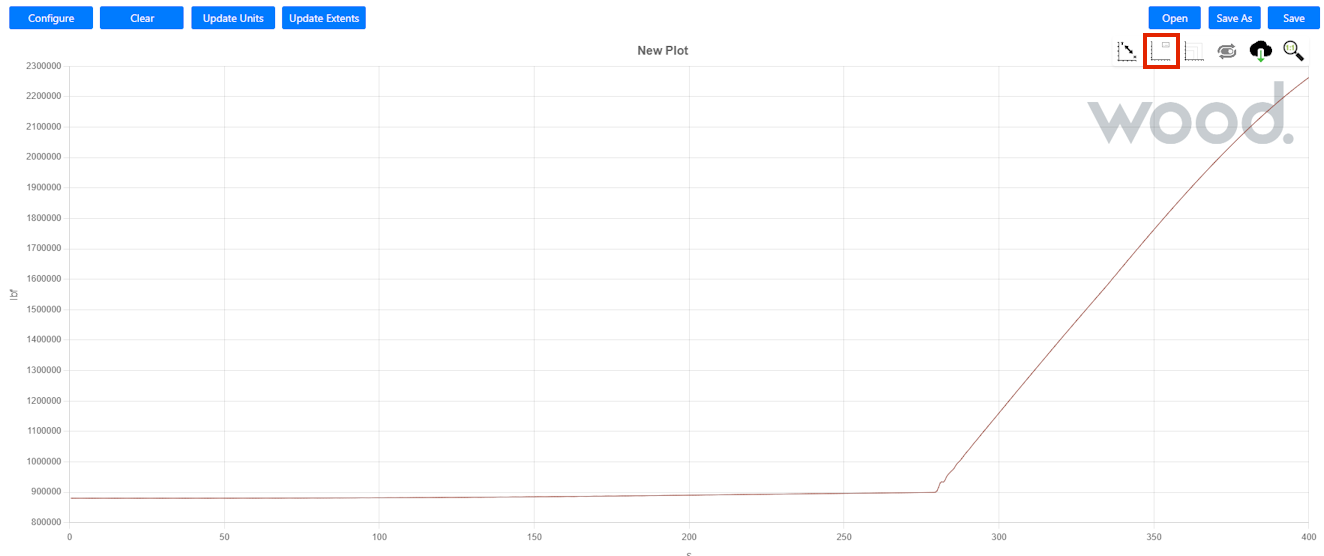
The Toggle Legend ON/OFF icon will either display or not display the Legend, depending if the icon is toggled on or off

The below chart shows the Legend button toggled on

This chart shows the Legend button toggled off
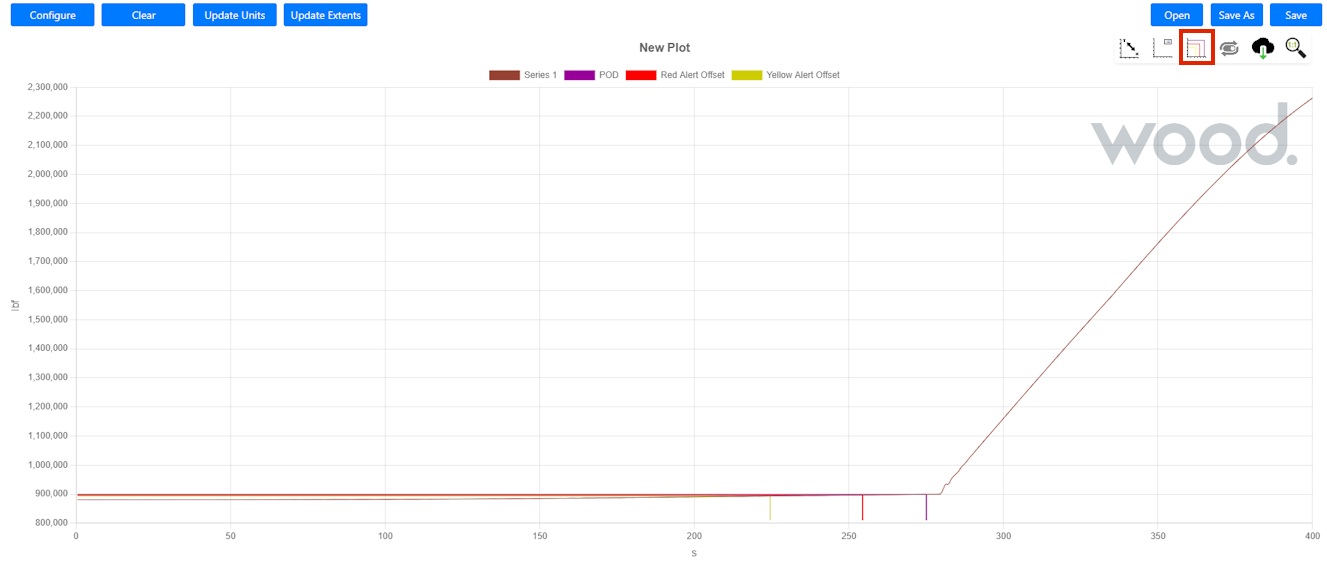
The below icon toggles EDS Limits. This is only available when viewing results for a Drift-Off Analysis.

The below chart shows the EDS Limit icon toggled on and POD, Red Alert Offset, Yellow Alert Offset can be shown
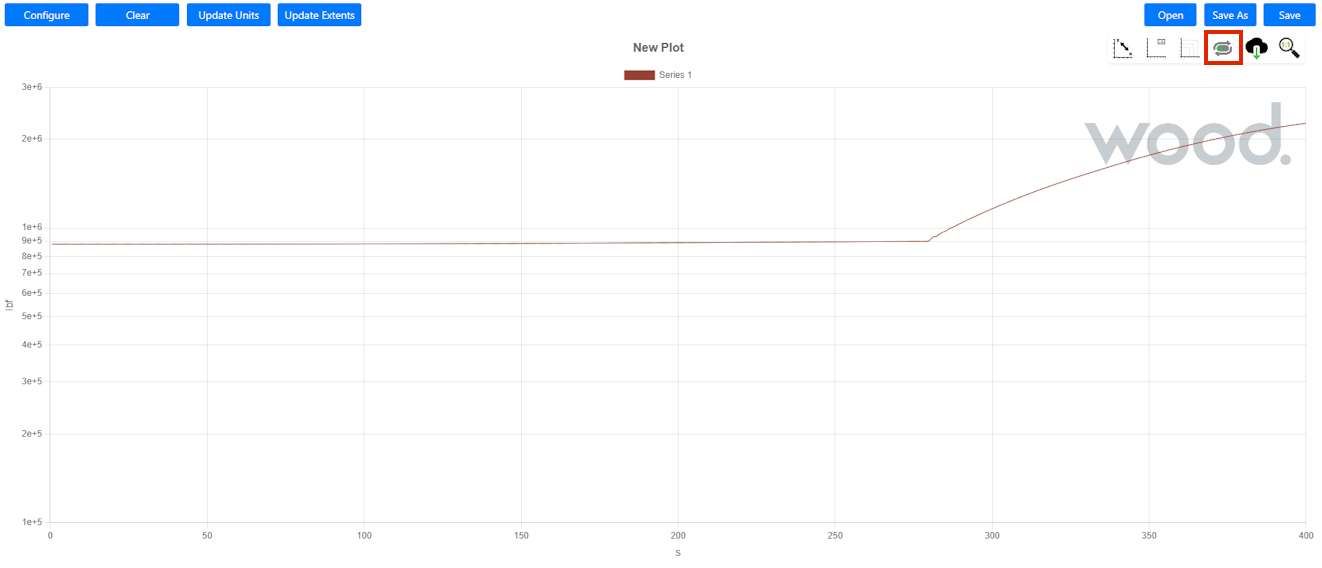
The below icon toggles between linear and logarithmic scales for the y axis

The below chart shows the button toggled on and it can be seen that the logarithmic scale types are shown on the y-axis
A CSV file containing the chart data can be downloaded by selecting the Save Chart Data icon

The mouse wheel can be used to zoom in and out of the chart. The zoom can be reset to its default by clicking on the Reset Zoom button
